Boutique

Booking enquiries went from 36 to 119 in one month. But there’s more to it than that.
Strategy · Digital · SEO
The Outcome
230%
Enquiries
43%
Organic Sessions
47%
Avg Engagement Time
What they faced
The Outlook
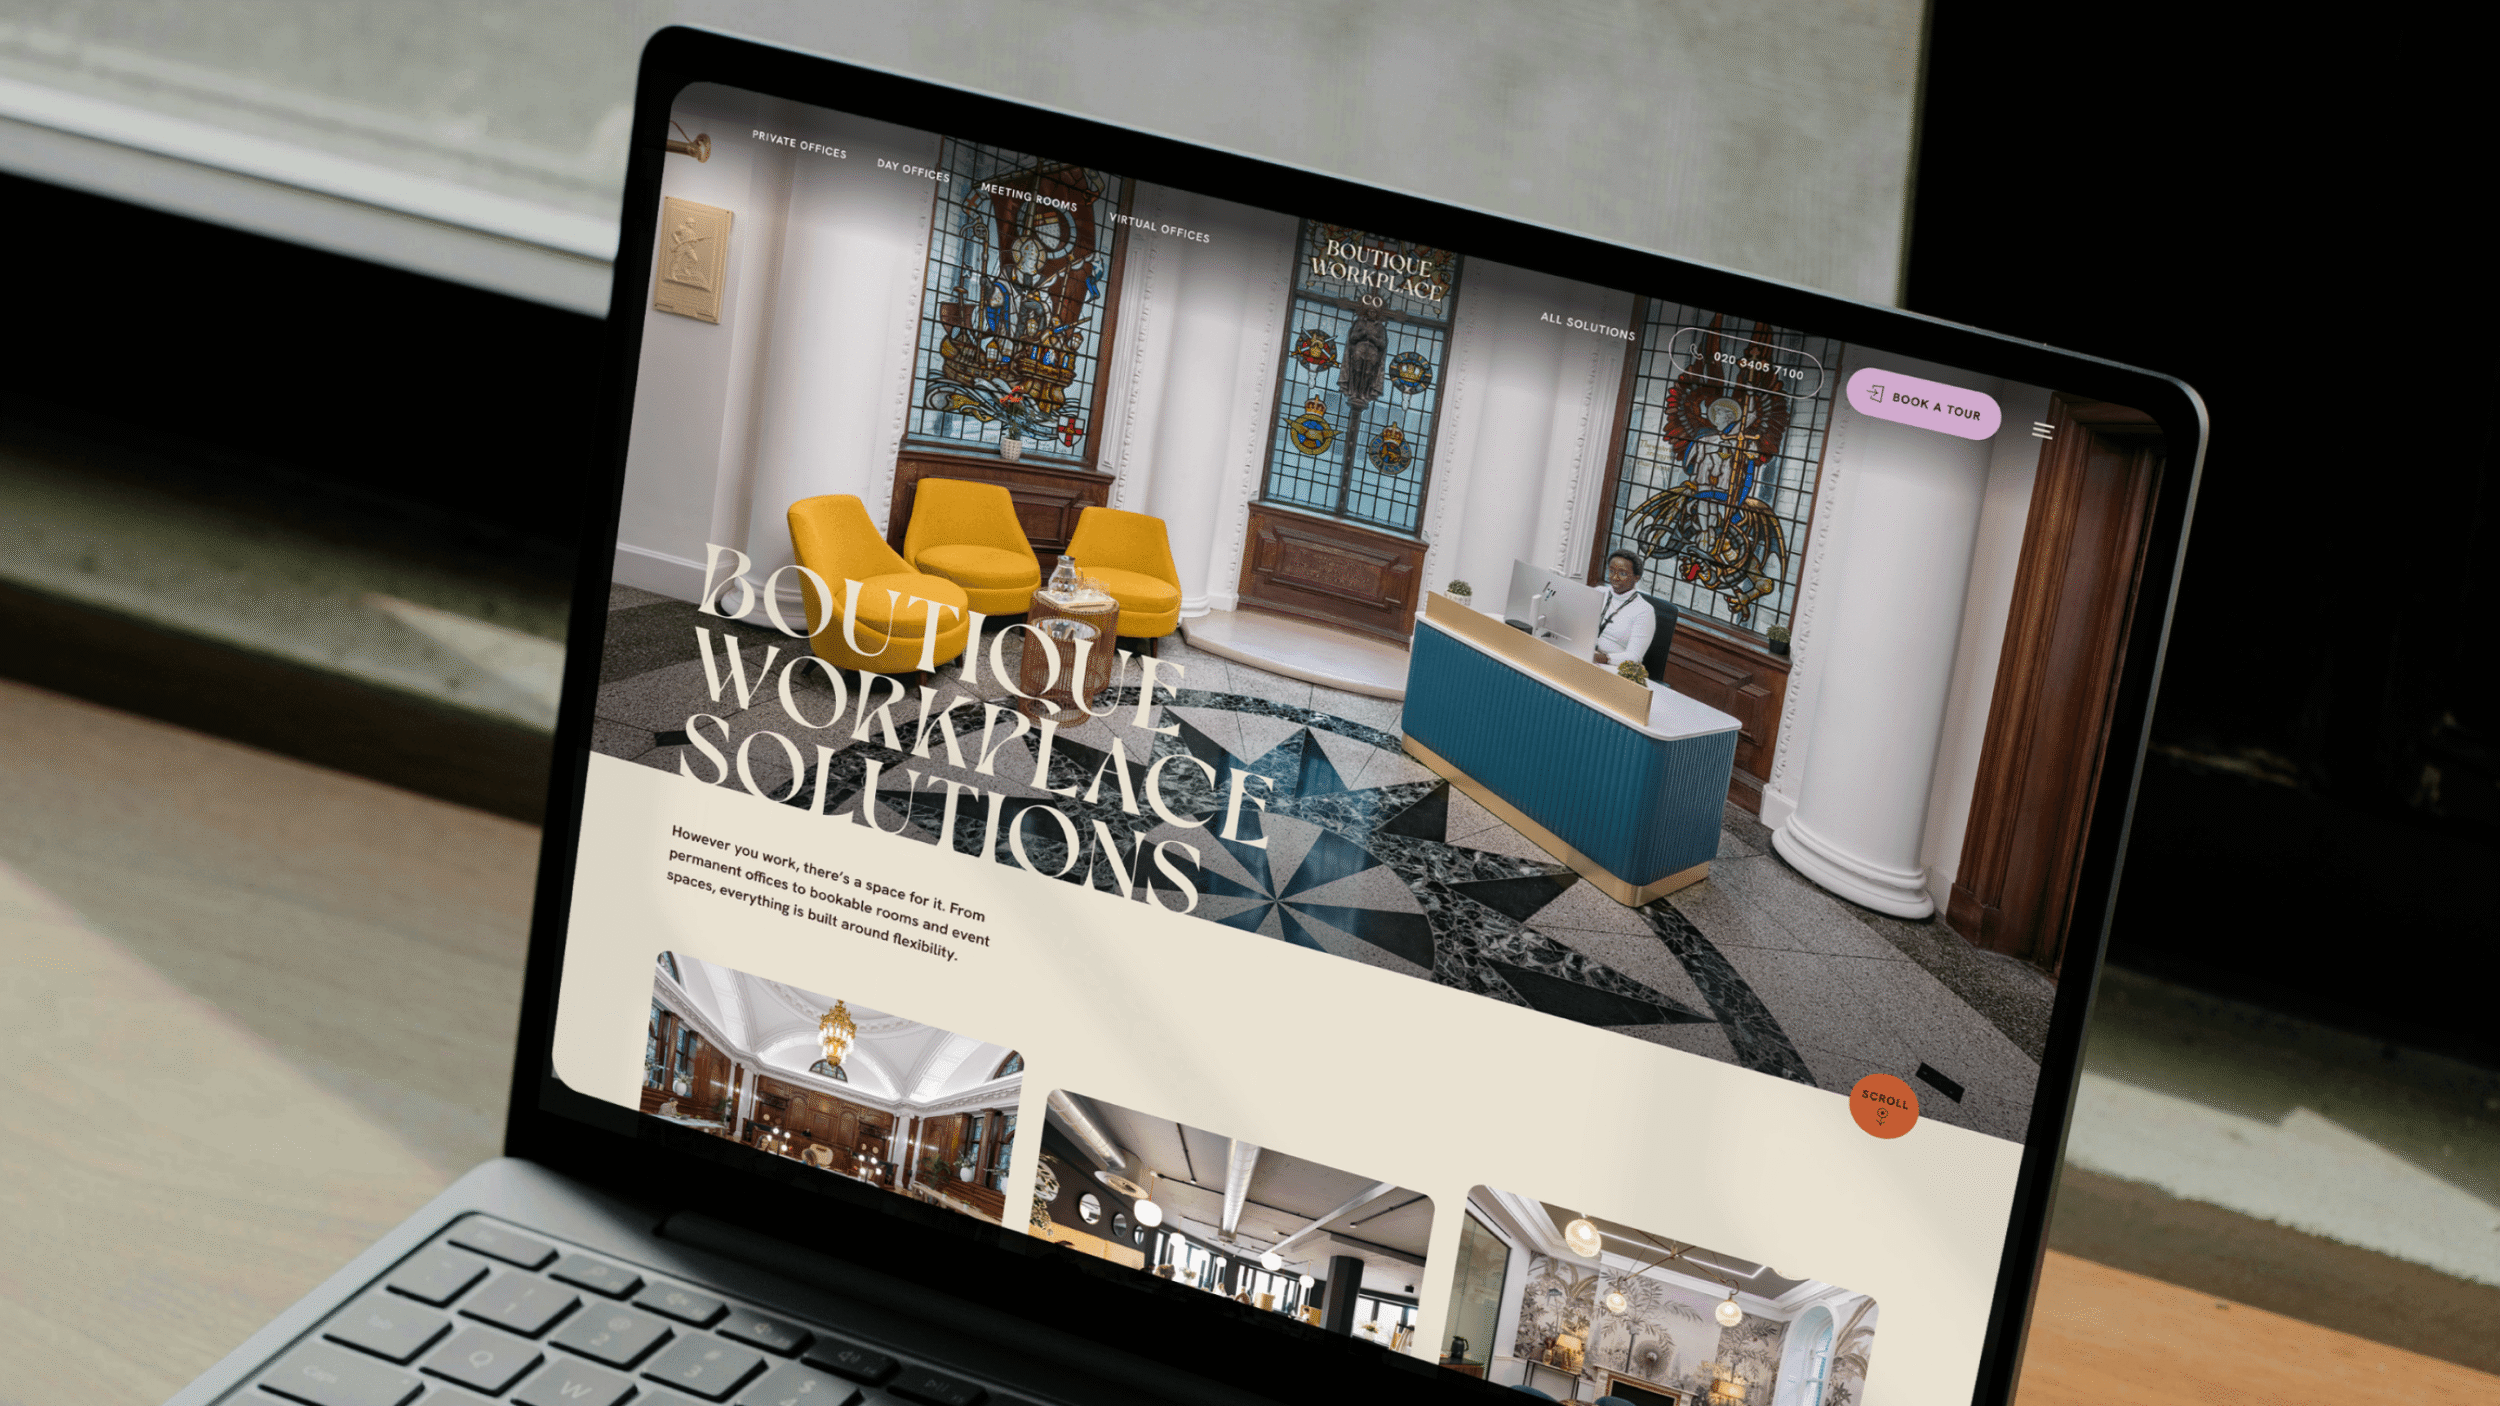
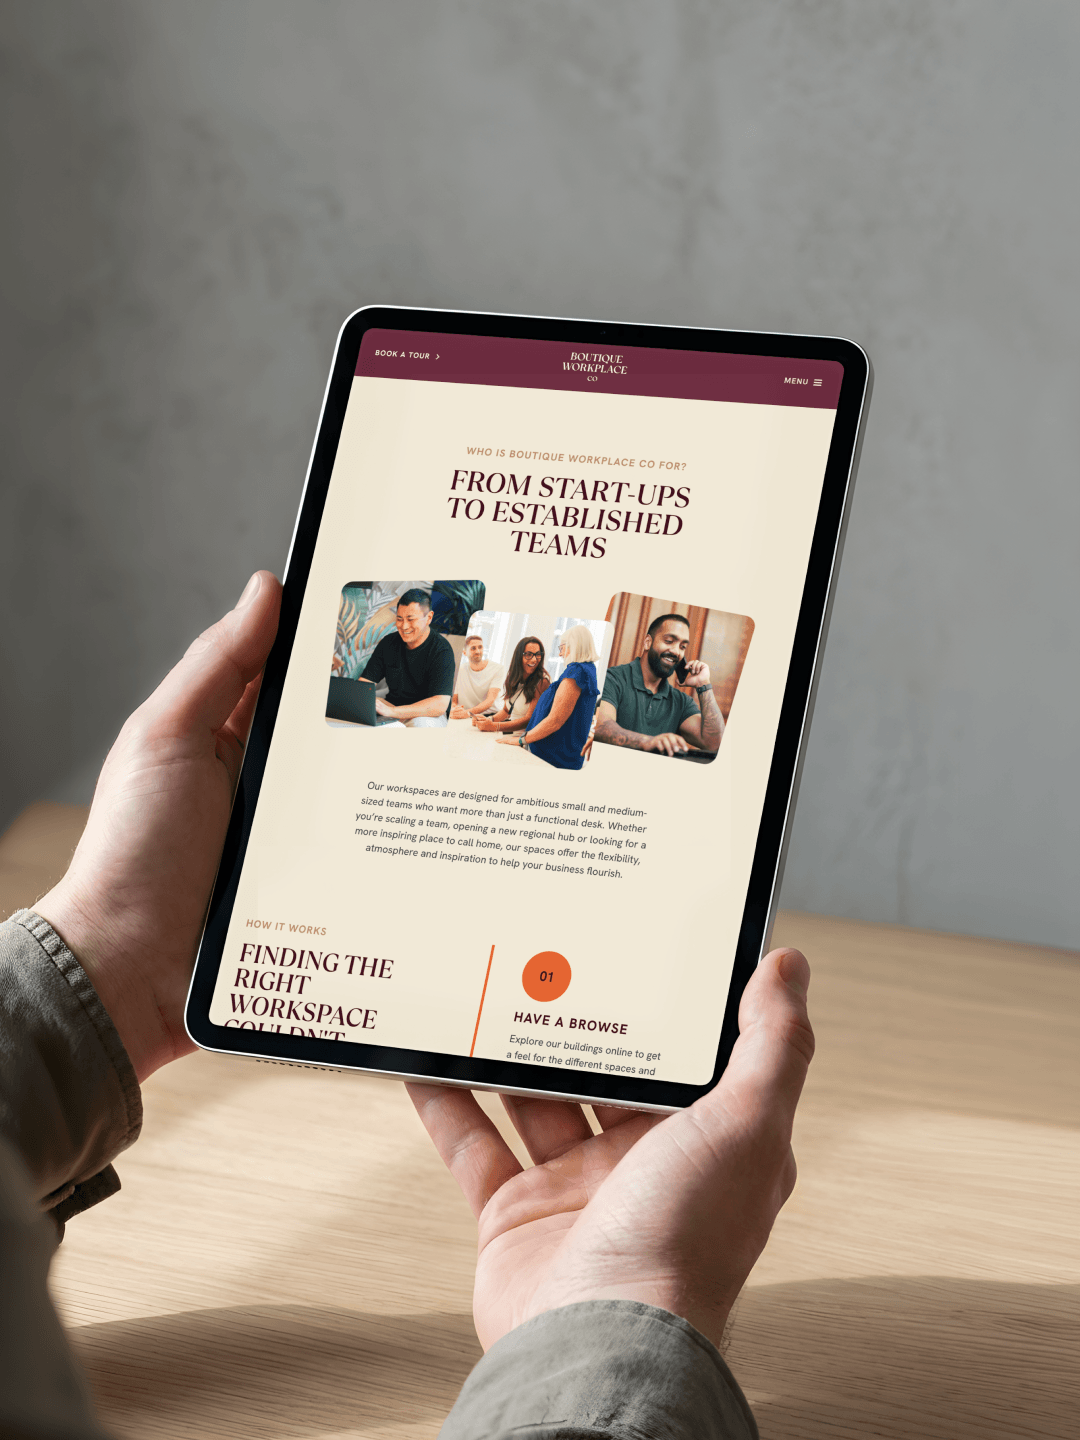
The Boutique Workplace Co. provides serviced offices, coworking and meeting spaces across five cities. Private serviced offices are the most profitable part of the business, so that’s where their marketing team needed the website to work hardest. The old site had been through years of changes. Besides a creaking architecture, it couldn’t tell prospective customers what was actually available. That meant every enquiry started from nothing.
Where we started
The Assessment
The problem wasn’t simply more enquiries. A visitor could say they wanted an office. They couldn’t say which one, what size they needed or when they needed it. If Boutique didn’t have the right space available, the conversation was over before it had really started. And there was no way for the website to know where those potential customers were being lost. The website needed to do more than generate enquiries. It needed to help people find the right workspace and give Boutique a clearer picture of what those people actually wanted.
What we discovered
Rather than jumping straight into redesigning the website, we ran a Gap Analysis™ to understand what was actually getting in the way. Three Performance Gaps stood out.
Conversion
The site collected interest without qualifying it. Every enquiry started from nothing, and every enquiry that couldn’t be matched to an available space ended there.
Experience
Visitors couldn’t see what was actually available. Boutique’s inventory was managed separately from the website, so the only way to find out whether a suitable space existed was to ask someone and wait.
Messaging
Years of accumulated content meant the website was trying to do too many jobs at once. The messaging needed simplifying so people could understand the offer and find what mattered to them more quickly.
Where we started, and why
Boutique were running their product inventory on a spreadsheet the website had no access to. With a website like this, the temptation is to start with the pages. After all, that’s the part everybody sees.
We started with the inventory
Design the search first and you risk building filters around assumptions, only to discover later that the data behind them can’t keep up. Solve the inventory first and everything that follows can be built around what the data can actually do. It’s not the most visible part of the finished website. But it’s the reason the site can tell prospective customers the truth about what’s available rather than simply looking like it can.
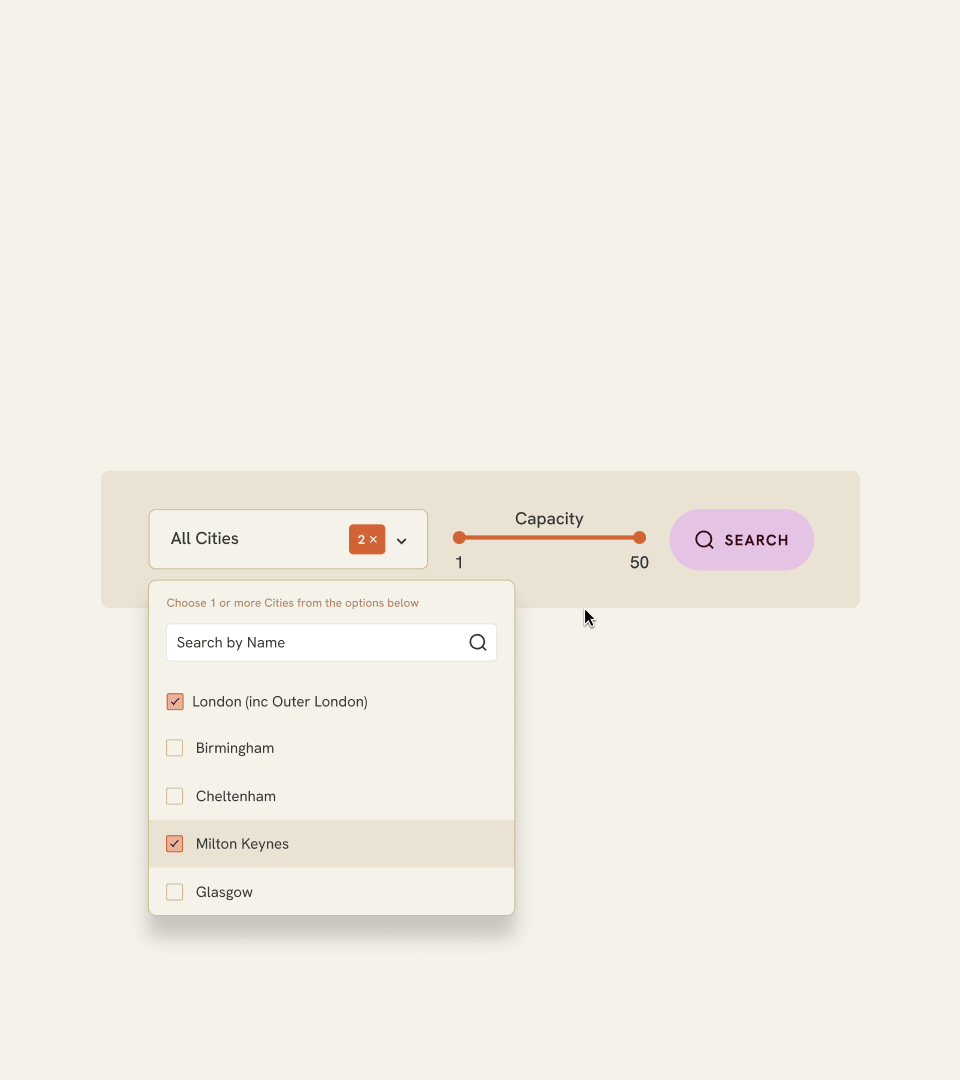
Once the inventory was sorted, we developed an API integration with Boutique’s Yardi system, bringing live property and workspace data into the website. Space details, availability, capacity, pricing and amenities are synchronised automatically, giving the website the data it needs to power search and filtering.
That means visitors can search for the right workspace based on what’s actually available then and there, rather than submitting an enquiry and waiting to find out.
What changed?
The Business Impact
Enquiries went from 36 to 119. Visits rose by 37%. Split those apart and the more interesting number shows up. If the new site had converted at exactly the old rate, the extra visitors alone would have produced around 49 enquiries, not 119. So roughly 40% of the gain is more people arriving. The other 60% is more of them deciding, once they arrived, that this was worth an enquiry. That second chunk is the site doing its actual job, not just bringing in more traffic to convert at the same tired rate.
The bonus that wasn’t part of the plan
Search traffic rose 43% within a month of launch. It wasn’t in the brief and it wasn’t the target. A jump that size, that fast, doesn’t happen by chance: the previous site had been suppressing search for years, and rebuilding it around what the data could actually support undid that as a side effect.
51%
Uplift in enquiries
Adam Nickson
Marketing Director

Launch isn’t where we stop
One month gives us an encouraging first picture. It doesn’t give us the whole one. So we’ll keep measuring what happens next: how people use the site, the enquiries it generates and, importantly, the quality of those opportunities. At 90 days, we’ll look again at what’s changed, what’s improved and where there are still gaps to close. And we’ll share what we find, whichever way it goes.
Looking for Impact?


Add in your details, then we’ll show you what’s holding you back and how to fix it:
- Your Gap Score™ as a quantified performance snapshot
- Key gaps across Positioning, Messaging and Funnel